Assessment Protocol and Methodology
Sweepers use the following protocol to gather assessment data. Sweepers typically work as a team in a canoe, with one person observing and calling out assessment ratings, while the other person records the information on handheld Garmin Global Positioning System (GPS) Units. The purpose of the assessments include the following objectives:
- Identification of emergency access points – the latitude/longitude is recorded on the GPS units.
- Identification of trash clusters – also recorded on GPS units.
- River health assessment – see below for protocol and methods.
Note: the word “health” is used to indicate functionality of the riparian ecosystem.
The methods we use are adapted from the USDA’s Stream Visual Assessment Protocol. The categories and scoring range (low scores indicate lower levels of functionality, high scores indicate higher functionality) are are as follows:
Canopy (0 – 4): An assessment of the amount of shade over either the left or ride side of the river. Each half of the river was given an independent canopy rating of 0%, 25%, 50%, 75%, or 100%. A 0 indicates no canopy, a 4 indicates 100% canopy coverage over the particular side of the river. To determine the canopy rating, the StreamSweepers assessed the amount of river surface area covered by vegetation.
Buffer (0 – 2): An assessment of the amount of the tree buffer on the riverbank. 0 indicates no buffer, 1 generally represents a buffer of a few trees, and 2 indicates dense forest, extending away from the river at least 50 feet.
Bank Erosion (0 – 2): An assessment of the quality of the bank, representing how much erosion has occurred there. A 0 represents no erosion, a 1 represents moderate erosion, and a 2 represents severe erosion.
Bed (0 – 2): Indicates the quality of the riverbed. A 0 indicates roughly 100% sand or silt (poor quality), 1 indicates a mix of sand and cobbles (moderate quality), and 2 represents a mostly cobblestone bed (high quality).
Bank Cover (0 – 4) : Indicates the type of plant matter covering the bank of the river. A 1 refers to only grass, a 2 represents only understory (small trees and shrubs), a 3 represents only overstory (large trees), and a 4 refers to the presence of understory and overstory.
Bank Geometry (0 – 2): An assessment of the geometry of the bank, measured by observing the angle of the bank’s ascent from the river. A 2 represents a 0 to 45 degree angle, 1 represents between a 45 and 90 degree angle, and a 0 refers to a bank that is 90 degrees to the river or undercut.
Bank Height (0 – 3): A measure of the bank’s height. In determining the height of the bank, the StreamSweepers approximated the different heights into four categories: 0-5ft, 6-10ft, 11-15ft, and >15ft. A 3 refers to a bank that generally does not go much higher than the water and a 0 means about a bank taller than 15 ft.
Invasive Species (0 – 1): Refers to the presence of invasive species alongside the river. A 0 indicates the presence of invasive species, and a 1 indicates absence.
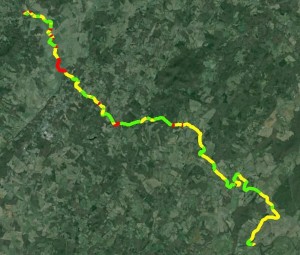
New assessment data points were recorded each time just one of the variables along the river changed. This means that in visually representing the assessment data on a map, colored lines representing the variables’ score stretch from each data point to the next, changing when the rating changes. As an example, the following map contains the assessment data for the river left (side of river as one floats downstream) side buffer of the Robinson. Red represents a 0, yellow represents a 1, and green represents a 2. Once all of the assessments were carried out, the data was transferred from points the GPS unit to color-coded maps made through use of Google Earth.

